Part III
Has SARS-CoV-2 become a seasonal virus and has COVID-19 become a seasonal disease?
Just a quick reminder of what we have covered so far in this blog series entitled: A Comprehensive Update on SARS-CoV-2 and COVID-19. We are taking this opportunity to look back over the first four years of the pandemic and all the insights we have learned about SARS-CoV-2 – the virus that has caused this pandemic – and COVID-19 – the disease caused by the virus – to review our current understanding as the science has evolved.
In Part I, we reviewed what we have learned about the biology of the virus, itself. This will be helpful to our understanding of some of the future topics of this blog series as we get into issues concerning the pathogenesis of COVID-19, the immunology of the disease, some of the clinical manifestations of the disease, and the therapeutic options for COVID-19.
In Part II, we discussed the transmission characteristics of SARS-CoV-2 over three blog posts, including the transmission mode, the evidence for airborne transmission, the incubation period, the serial interval, the infectious period, viral shedding; transmission in classrooms, on airplanes and in health care facilities (nosocomial infection); and we concluded our review of the science with a critique of the new CDC Respiratory Virus Guidance.
We now move on to Part III to examine the question as to whether SARS-CoV-2 has become a seasonal virus and whether COVID-19 is a seasonal disease, such as influenza and RSV, which is a commonly held belief among the public and one that wittingly or unwittingly, the CDC seems to be promoting.
- What does it mean for a virus and its infection to be seasonal?
Some viral illnesses demonstrate a pronounced seasonal variation in incidence. That does not mean that they cannot transmit at other times of the year, or even all year-long, however, these viral diseases show marked increases in transmission and disease incidence during certain months of the year. In classic cases, such as influenza, epidemic levels of transmission generally occur in the winter months, which is evident by increased transmission in the southern hemisphere in our summer (their winter) and by increased transmission in the northern hemisphere during our winter (summer in the southern hemisphere), which is actually helpful in our management of influenza by allowing us to identify strains of influenza circulating in the southern hemisphere ahead of our winter surge to assess and to predict how severe our influenza season might be, whether adults or children are being predominantly impacted with severe disease, and to anticipate the effectiveness of our influenza vaccine for that year.
Seasonal virus activity is generally limited to or predominantly displayed in temperate climates (climates in which there are warm to hot summers and cool to cold winters) as opposed to tropical climates (where the weather tends to be hot and humid year-round) or polar climates (where the weather tends to be cold year-round).
- What does the epi curve for a seasonal virus look like?
Influenza is a classic example of a seasonal virus. Let’s look at the epi curve for influenza in the U.S. during the 2012 – 2013 flu season:
Figure 1. Epi Curve for Influenza 2012 – 2013 season
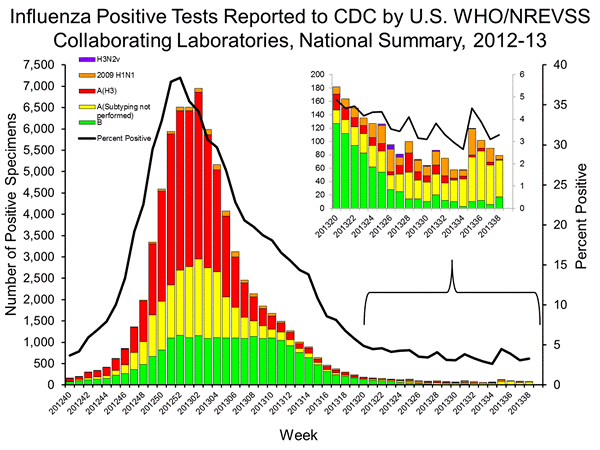
Epi curves plot the number of cases along the y-axis (vertical; ordinate) in this case based on a positive test confirming influenza infection over time plotted along the x-axis (horizontal; abscissa) in this case by week. The CDC uses the convention of numbering the weeks from 1 – 52 (or in some years, 53) as so-called MMWR weeks, where the first day of each week is Sunday and the week numbered 1 is the first week of the year that has at least four days of the month of January in it. So, in Figure 1, the beginning time point is week 40 of 2012, which began on September 30.
The black line represents the test positivity rate for those presenting with influenza-like illnesses (ILI). With the beginning of fall, we see a number of seasonal respiratory illnesses begin to appear, so not everyone who presents with flu-like symptoms will have influenza infection, especially towards the beginning and the end of the season. So, for that week beginning September 30, we see that roughly 4 percent of those with ILI tested positive for influenza, meaning that the overwhelming majority of those presenting for evaluation were likely were infected with other respiratory viruses. Contrast that with the peak of the influenza season when almost 40% of those with an influenza-like illness will in fact test positive for influenza.
The bars of the bar graph indicate the number of persons testing positive for influenza and the colors indicate whether the influenza virus identified in those with positive tests was type A or type B, and for those samples for which subtyping was performed, we can see that the majority of the type A viruses were of the H3 subtype in that year’s influenza season.
As I mentioned above, seasonal viruses/infections don’t necessarily mean that there are no infections throughout the year beyond the season in which they surge, but rather that when there are, they are at low and relatively stable levels. We can see at the far-right part of our graph, following the fall/winter flu season, that transmission levels remain fairly low and stable with what appears to be less than 100 infections in the entire country each week.
So, going back to the left side of the graph, we can see that infections are gradually increasing above that baseline of less than 100 infections per week each week, until we begin to see a big jump around week 47, which would be the week of November 18, where cases are in the neighborhood of 1,500 (or more than 15-times higher than what we would typically see at baseline in the off-season for influenza) for that week. We then see that influenza cases peak during the second week of 2013, which would be the week of January 6th. Cases get down to the baseline level of less than 100 cases/week around the 26th week of 2013, which would be the week of June 23, but cases are down to the starting point of the surge that we saw on the left-side of this graph about six weeks earlier than that.
Now, the other thing about seasonal respiratory viruses is that we should see essentially the opposite pattern when we look to the southern hemisphere, and so let’s look at Australia’s influenza epi curve for the same flu season:
Figure 2. Epi curve for 2012 influenza season in Australia

Again, we have the number of infections plotted on the y-axis and the weeks along the x-axis, however, Australia does not use the MMWR week numbering system, which makes my life easier. So, for Australia (I picked that country because it is in the southern hemisphere and they do a very comprehensive program of influenza surveillance). We see that their baseline infection rate is below 100 per week as is ours, in fact, below 50 cases per week. We can see their seasonal influenza epidemic begins to take off right around the week of June 17. The peak in Australia was around August 12, approximately six weeks before cases in the U.S. began to increase and about 5 months prior to our peak. Recall that in the U.S. that year, our cases began to take off around November 18, which is past the time period shown in Figure 2, and after Australia’s seasonal epidemic has receded and essentially returned to baseline infection levels. This is why I look to what happens in Australia’s influenza season to get an idea of (1) how bad is our influenza season likely to be and (2) does it appear that the influenza vaccine is a good match based on the subtypes of influenza identified circulating in Australia during their flu season.
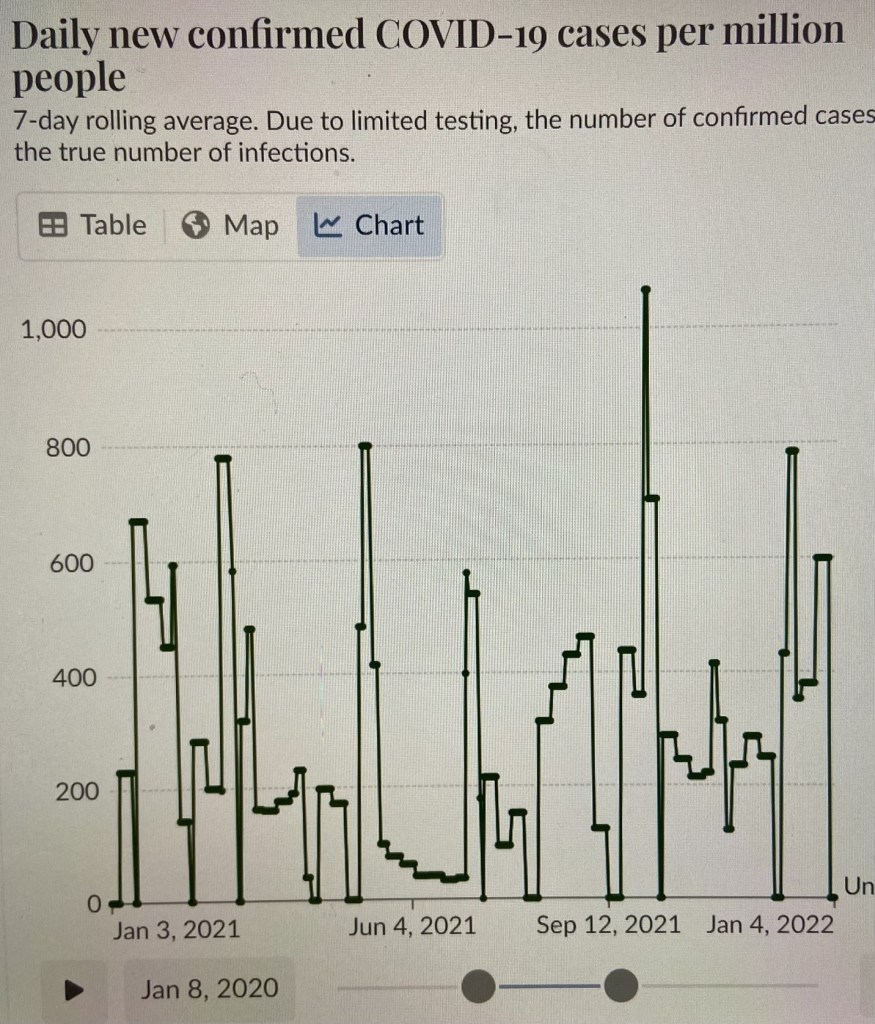
So, those are epi curves for a classic seasonal virus. Let’s look at the epi curves for SARS-CoV-2/COVID-19. We will start with Figure 3 – the COVID-19 epi curve for the U.S. I selected the time period of January 3, 2021 through January 4, 2022, because we were still testing and reporting cases on a regular basis.
Hopefully, as you look at Figure 3, you see that it is quite different than the epi curves we examined in Figures 1 and 2 with a seasonal virus. In Figure 3, we see that the number of confirmed cases of COVID-19 appear in successive surges throughout the year reaching peaks in the third week of January, an even higher peak in the first week of March, a just slightly higher peak in the middle of May, another peak, though lower, in the first week of July, another peak at the end of August/beginning of September, the highest peak of the year at the beginning of October, a much smaller peak during the first week of November, and then a peak comparable to the peaks in March and May that occurs in the middle of December. In other words, we see peaks in all four seasons, so this quite clearly is not a seasonal virus or disease.
Figure 3. Epi curve for COVID-19 confirmed cases in the U.S. 1/3/21 – 1/4/22
What if we look to the southern hemisphere for the epi curve for COVID-19? Let’s examine Australia’s epi curve for the same time period:
Figure 4. Epi curve for COVID-19 in Australia

Figure 4 is the same time period as Figure 3. Notice the peaks in Australia occurred the middle of March, the middle of May, the middle of July, the third week in September, the middle of October and then a huge peak immediately following Christmas. Notice that unlike for influenza, for COVID-19, the peaks are occurring roughly at the same time in both hemispheres, even though the magnitudes of those peaks are different, likely due to different mitigation measures, different COVID-19 vaccine schedules and roll-outs, and different infection histories. Nevertheless, SARS-CoV-2/COVID-19 clearly are not seasonal.
- What factors contribute to a virus being seasonal?
We don’t have a full understanding as to all the factors contributing to seasonality in the transmission of some viruses, and why we can see slight changes from year-to-year, and why some viruses of the same family have slightly different times of seasonal increased transmission (e.g., the seasonal common cold coronaviruses). Nonetheless, there is much we have learned. Seasonality can be impacted by biological properties of the virus, biological properties of the vector or intermediate host, biological properties of the ultimate host, weather changes, and human behavior.
We have known for some time that weather conditions can affect transmission levels for some viruses, though the relative contributions of biological properties of the virus, such as temperature, humidity and UV light sensitivity of the virus versus the role played by changes in human behavior – school year, travel over holidays, gathering in close quarters, etc. is often subject to differences of opinion. Interestingly, many of the commonly occurring respiratory virus infections, e.g., influenza and RSV, tend to peak in the winter months, while many of the viruses that cause rashes in children that are transmitted by the respiratory route tend to peak in the spring. For example, measles tends to peak in late winter and early spring in temperate climates. However, in the tropics, the peak incidence of measles tends to be late in the dry season, with an abrupt decrease when the rainy season begins. In contrast, influenza and rhinovirus infections tend to peak in tropical climates during the rainy season.
Examples of differences in biological properties of viruses include measles, influenza and vaccinia viruses that survive in air better at low humidity compared to viruses like polioviruses, rhinoviruses and adenoviruses that survive longer in high humidity environments. However, even this can be confounded by changes in host biology such as when they have drying of their nasal passages and oral cavities due to the low humidity of air conditioning and central heating.
The movement of large numbers of people indoors in poorly ventilated buildings during the cold winter months is an example of human behavior that may promote the transmission of airborne respiratory viruses.
On the other hand, viruses transmitted by vectors such as mosquitoes or sand-flies (most notably arboviruses) show seasonality (summer months), not so much because of intrinsic properties of the virus, but because of the life cycle of the mosquitoes and sand-flies that carry and transmit the viruses to humans. However, the seasonality and geographic area where disease occurs can also be affected by the host animal. For example, the host of the West Nile virus is predominantly birds (humans are incidental hosts). The virus circulates at high levels in the blood of the affected birds (in many species, but most notable in crows because of the high mortality rate for crows that leaves visible evidence of their carcasses when there are high levels of circulating West Nile virus). The intersection of the time when mosquitoes hatch and are active and the location of these bird species during the time mosquitoes are active (e.g., before migratory birds have headed south) in part explains the predominance of this disease being primarily transmitted in the Great Plains states between the months of July and October.
Similarly, viruses transmitted by ticks most commonly tend to be transmitted in the spring and early summer or in the fall based on the life cycle of the tick. As one example, the virus that causes Powassan disease is carried by the deer tick (Ixodes scapularis) most often produces cases in the United States occurring in the northeast and Great Lakes regions from late spring through mid-fall when ticks are most active:
Figure 5. The life cycle of the Ixodes scapularis tick.

I hope that I have made a clear case, provided you with our current understanding of what contributes to seasonality of some viruses, and shown you the data that demonstrates that COVID-19 transmission cycles throughout the year (we’ll discuss why we think that happens in the next blog post that follows) rather than with seasonality. Of course, it is always possible that in the future that SARS-CoV-2/COVID-19 could become seasonal, but it clearly is not at present (while I showed you data from 2021 because we had good testing and reporting, if you were to examine time periods since then, you still see the year-round transmission with regularly recurring peaks, as opposed to the low and stable level transmission you can see with a seasonal virus like influenza).
References:
- Fenner and White’s Medical Virology, 5th edition.
- CDC
- Our World in Data https://ourworldindata.org/covid-cases.
- Misconceptions about weather and seasonality must not misguide COVID-19 response | Nature Communications
