Part II
Transmission Characteristics of SARS-CoV-2
- Transmission mode
SARS-CoV-2 is transmitted through aerosols. This is a fine mist that is like spraying hair spray or deodorant, but is not visible. These aerosols are generated by the breathing, talking, yelling, singing, coughing or sneezing of a person who is infected by the virus. Initially, it was thought that SARS-CoV-2 was transmitted by respiratory droplets only, larger drops that are emitted from the mouth and nose, that generally travel short distances of perhaps up to 6 feet. While someone in close contact to an infected person can be infected by respiratory droplets, we now have evidence that the primary mode of transmission is aerosols, and that makes a huge difference.
Aerosols are carried on air streams. That means that the virus can remain suspended in the air indoors for some period of time and can travel to most anywhere in an area that is served by the same air handling systems, though this will be impacted by where the air return is. This is why I have urged schools to increase the number of air changes per hour of their ventilation systems. The higher the number of air changes, the less time virus will remain suspended in the air. Further, I was alarmed to find on my school walk-throughs how often the teacher’s desk was located right under the air return. That meant that any virus kids were emitting into the air was being directed right at the teacher! There are many things that can be done to improve the quality of air in schools (and businesses) that will reduce the transmission of all airborne viruses and bacteria. We’ll cover that subject in a subsequent blog post.
We have lots of evidence to support aerosol transmission for SARS-CoV-2. This mode of transmission is also the only logical explanation for superspreader events. I will just cover two of the many studies that demonstrate how we can be confident that aerosol transmission occurs:
- In a very well-done epidemiological investigation, the Marin County Public Health studied an outbreak of COVID-19 in an elementary school after an unvaccinated teacher had developed symptoms, but continued working until receiving a positive COVID-19 test two days later. A masking requirement was in effect at the time; however, the teacher removed the mask when reading aloud to the class. Four days after the onset of the teacher’s symptoms and two days after the positive test, other cases of COVID-19 began being reported by students, staff members, and parents and siblings with a family member at the school. Using contract tracing whole genome sequencing from the teacher’s sample and those of others who were infected, public health officials noted the following:
- 12 of the 24 students in the class tested positive between the period of 4 – 8 days after the onset of the teacher’s symptoms;
- The attack rate (infection rate) for students in the first two rows nearest the teacher’s desk was 80% (8 of the 10 students); and
- The attack rate for the last three rows of students was 28% (4 of 14 students).
This illustrates nicely that while with respiratory droplets, you would expect the infections to be limited to the front row, and perhaps a few in the second row, perhaps infecting a handful of children, the large number of infections and the fact that there were infections in the back three rows demonstrates that transmission could not likely be merely by respiratory droplets.
- This second study investigated a cluster of COVID-19 cases following a 10-hour international flight. The index case was identified as the only symptomatic person as of take-off, a passenger sitting in business class (seat 5K – identified by the red-colored seat). The attack rate of others seated in business class was 62% (all those seated in orange-colored seats were infected).
Here is the diagram of those infected based on seating on the flight:

Notice that the index case sat in row 5K, yet she infected persons two rows ahead of her and two rows behind her. In addition, she infected a passenger on the other side of the plane (seat 5A), three rows over. But also note that she infected a person 15 (seat 23H) and 16 rows (seat 24E) behind her. Although airplanes have very good air handling, including the use of HEPA air filters, it requires the engines to be on and those of you who are frequent flyers will note that the engines often are not on while the plane is at the gate. Further, we know from an epidemiological study of an outbreak in China that transmission can occur during the brief period of time while passing by someone walking in opposite directions. Thus, boarding and the time spent sitting at the gate are likely the riskiest times for transmission.
- Incubation period
The incubation period is the amount of time that transpires between exposure to a pathogen (in this case, the SARS-CoV-2 virus) and the development of symptoms (in this case, those of COVID-19). The serial interval is the amount of time between cases developing in a transmission chain.
Let’s take an example to help illustrate this. Suppose that the incubation period for a virus that we can easily test for is 4 days. Husband comes home from work on Monday and reports symptoms consistent with that viral infection and tests positive the next day. His wife felt well on Monday and Tuesday, but becomes ill with similar symptoms on Wednesday and has a positive test for that same virus. The serial interval would be 2 days (Monday – Wednesday). The significance of these two measurements is that when the serial interval is less than the incubation period, it suggests that there is pre-symptomatic transmission.
In our example above, we would assume husband was infected 4 days prior to Monday (the day he developed symptoms) because the incubation period is 4 days, i.e., he was infected on Thursday of the prior week. But, for his wife to be sick on Wednesday, she would have been infected on Saturday. But, unless another source of infection was identified through contact tracing, that means that her husband became infectious before he became symptomatic, at which time he infected his wife. And, in fact, this is what we see with COVID-19 – a serial interval that is less than the incubation period meaning that you can be around someone who appears and feels perfectly well, but they are infectious. This is one of the most challenging aspects of containing the transmission of this virus, and, as you will see below, we seem to be on a track to make it worse.
With the example I provided above with the serial interval being less than the incubation period, that means that an infected person may infect others before they have developed symptoms. This period from exposure (the same starting point as for incubation period) until infectiousness is called the latent period. When the latent period is essentially the same as the incubation period or when it is longer (i.e., people develop symptoms at the same time the become infectious or prior to becoming infectious), as happened with the original SARS virus in 2002/2003 and as it is for Ebola, the disease is much easier to contain. That is because when people aren’t transmitting the virus to others before they become ill and are very sick or visibly ill once symptoms develop, as tends to happen with these two diseases, they generally stay home or enter the hospital, thus, they are not typically spreading the disease at school, at work, at concerts and at parties. Unfortunately, the spread we see tends to be to care-givers who are caring for these very sick folks.
Now, real life is not so straight-forward as the example I provided you with that had exact days for the incubation period and serial interval. In reality, both of these periods typically involve a range from the earliest that we see to the latest that we see and with most people being somewhere in the middle. Further, there are things that can shorten or lengthen the incubation period. For example, if one is exposed to a high volume of virus (viral dose), as for example, because you were very close to the infected person for a prolonged period of time, the incubation period might be shorter. On the other hand, if one already has some degree of immunity through vaccination or prior infection, the incubation period can be longer. Plus, the incubation period can change with changes to the virus (e.g., variants that have increased transmissibility, as has happened repeatedly throughout the pandemic may have shortened incubation periods), and in fact, some researchers believe that the incubation period with the more recent Omicron variants is more likely 1 – 4 days) (see below for more on this).
The incubation period and serial interval can be observed in a population with contact tracing, and typically become evident soon into an outbreak. Knowing the incubation period and subtracting the serial interval from it gives us a pretty good idea as to the beginning of the infectious period (the period of time during which an infected person can infect another person).
Knowing the incubation period for a virus is also key to developing guidance for quarantine periods for those who are exposed and for determining when an outbreak has ended (e.g., with last year’s measles outbreak in Ohio, that outbreak was officially declared over when two incubation periods [the incubation period for measles is up to 21 days] had elapsed [so, a total of 42 days] with no further cases being identified). However, in determining the isolation period, we need to know the infectious period.
With an outbreak of a novel virus like SARS-CoV-2, this is the ideal time to determine the incubation period. Assuming that there are not other circulating viruses causing similar symptoms, people generally should have been well prior to becoming infected with this new virus, so we usually have clear information as to when symptoms began. Also, at the start of an outbreak, you have fewer individuals infected (i.e., don’t yet have community spread), and contact tracing is manageable increasing the chances that we can connect cases together in a transmission chain. For example, Idaho’s first known and confirmed case of COVID-19 was identified on March 13, 2020. The patient was a woman who had traveled to New York City to attend a conference at which there was an outbreak of COVID-19 with at least 3 confirmed cases, besides her. Her attendance was within that 2-week incubation period and given that she was the first case in Idaho, we can be fairly confident that she was infected at the conference rather than once returning home.
Between January 4 and February 24, 2020, researchers could identify confirmed cases of COVID-19 and trace many of those cases back to a close contact with a person who tested positive, and they could determine the average number of days from exposure to onset of symptoms in a person with confirmed COVID-19. That number was 5.6 days. As, I mentioned, when you look at incubation periods, you get a range. In the case of COVID-19, there were some, but few, who became symptomatic in as few as 2 days after exposure, and again some, though few people who developed symptoms as far out as 14 days following an exposure. This was the basis for the CDC stating that the incubation period for the virus is between 2 and 14 days with the median being 5 days.
Researchers also began to look at the serial interval which indicated that, based upon this incubation period, it appeared that infected persons could be transmitting the virus as much as 3 days before they became symptomatic, but it appeared that they were most contagious 1 – 2 days prior to the onset of symptoms and during the first week of illness. The CDC determined that if someone had mild to moderate COVID-19, they could remain contagious for up to 10 days from the first day of symptoms. In the case of severe disease, the person could be contagious for up to 20 days from the start of symptoms. [Note: Mild disease is asymptomatic infection, or common symptoms such as fever, sore throat, cough, aching, fatigue, etc., but without shortness of breath or a drop in oxygen saturation. Moderate disease is any symptoms accompanied by shortness of breath. Severe disease is illness requiring hospitalization, often for the administration of oxygen and IV medications, which includes, but does not require, the need for critical care.]
We call this time period where the infected person can transmit the infection to others the infectious period. This infectious period served as the basis for the initial isolation (isolation is for infected persons) guideline of 10 days. The incubation period served as the basis for the quarantine (quarantine is for exposed persons) guideline of 14 days. Of course, if while quarantining, an exposed person develops symptoms and tests positive for COVID-19, then they switch over to the isolation guideline.
Obviously, you would want the isolation period to align with the infectious period if you want to control the spread of an infectious disease. The problem is that the infectious period is very difficult to determine when there is widespread disease, many potential exposures in people’s everyday lives, and the pandemic has been going on for an unprecedented four years with most everyone having some degree of immunity from vaccination, prior infection or both.
We can certainly get an idea of the infectious period by examining epidemiological data, for example when identifying the source of the infection and those persons infected by that index case, what was the shortest and the longest periods of time between the index case developing symptoms and the subsequent person becoming infected. However, more precise measurements of the infectious period require laboratory tests that either indirectly or directly measure the presence of infectious virus in an infected person over a period of time.
The reason most reporting of infectious virus is inferential rather than direct is that tests for determining whether virus is infectious take a lot of time, are more costly to perform, and have to be performed in specialized laboratories, so by the time a physician can get the report back, it is too late to be able to advise a patient as to whether they remain contagious.
One of the first ways we tried to estimate the infectious period with SARS-CoV-2 infection was by following the course of quantitative PCR tests over the days following initially testing positive as a proxy for viral load and viral shedding (and therefore, assumed infectivity). PCR (polymerase chain reaction) tests are the kind of test you received if you were tested for COVID by a doctor or hospital prior to the over-the-counter tests becoming available (although there is now an over-the-counter PCR test available for home use). These tests are the gold standard for diagnosing SARS-CoV-2 infection. To perform this test, a swab was inserted up your nose far up to ensure obtaining a sample from the nasopharynx, where the SARS-CoV-2 virus was thought to be most actively replicating. Of course, once you realize that the virus is transmitted through aerosols, even without coughing, the virus pretty much has to be in the person’s nose and throat to be able to be emitted with breathing and talking in aerosols and in the respiratory droplets formed by the fluid and secretions in our mouth and nasal passages.
The sample is then placed in a tube containing a transport medium that allows the sample to be transported to a laboratory where the sample is probed for detection of the RNA that is unique to the SARS-CoV-2 virus. The process involves nucleic acid amplification, by which even if there are minute amounts of RNA from the virus in the sample, we can amplify the amount of virus every time we do a cycle of testing, until there finally is enough virus present that the test detects it. When these tests were performed in the lab, they were generally reported to the physician with the CT (cycle threshold) value. So, the lower the CT value, the lower the number of times the sample had to go through the amplification process to get to a level of RNA that was detectable, which meant that the starting amount of RNA was quite high, which then gives us the inference that the person’s viral load is quite high, and the additional inference that the person was then likely shedding virus, and therefore, infectious. Conversely, a very high CT value (e.g., 35 or 40) would imply very low levels of RNA, implying a low viral load and an inference being made that there would be low shedding. Now, not all of these assumptions are necessarily true in all cases. I address the issue that viral load doesn’t always correlate with viral shedding below. Further, detection of RNA does not mean that the virus is intact (e.g., once the antibodies and T-cells get to work, you might have viral debris left over with remnants of the RNA, but viral debris is not likely to be infectious). Nevertheless, this was one of our easiest and quickest ways to get a proxy for infectious period.
Figure 1. Tests for determining infectious period.
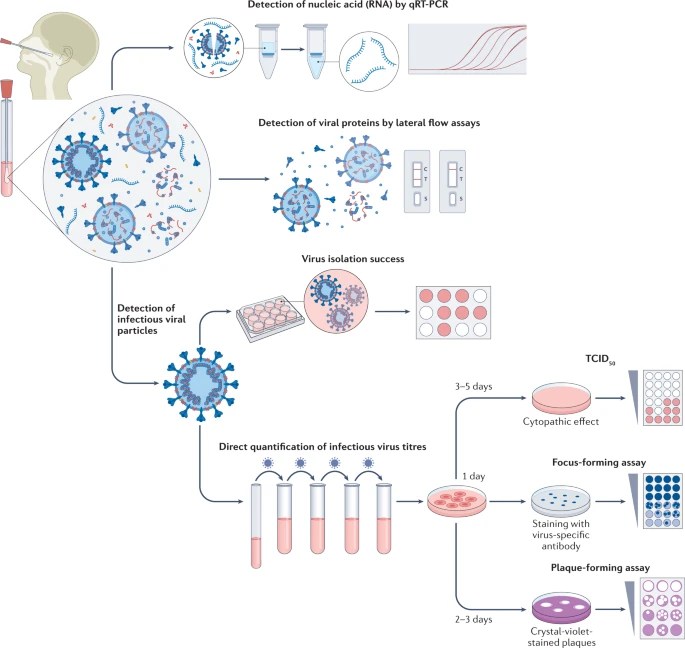
Much later into the pandemic, rapid antigen tests (also called lateral flow assays and abbreviated as “RATs”) became available over-the-counter and Americans could order limited numbers of free tests from the government at various points during the pandemic. Whereas the PCR test identifies the genetic material of the virus, the rapid antigen tests are chemical reactions that detect the N-protein of the SARS-CoV-2 virus (if you need to review what the N-protein is, look at Part I of this blog series on the biology of the virus). With earlier variants, there seemed to be a fairly good correlation between positivity on the RATs and infectivity, and as a result, the CDC provided guidance that testing with RATs could be one way to end isolation early. However, with more recent variants, perhaps due to the greater immunity in the population, it appears that this correlation has weakened to the point that it may not be as reliable.
The most precise tests are those at the bottom of Figure 1. These are tests that actually isolate whole SARS-CoV-2 virus or quantify viral titers (viral load). While PCR and RAT tests give an indication of viral shedding, they can both overestimate that period of time because they may detect viral debris that is not capable of infecting, whereas these methods detect whole virus, and one of those methods is actually based on detecting the virus infecting and causing damage to cells in a culture, give the best indication that the person is shedding infectious virus. The identification of SARS-CoV-2 virus in cell culture is the gold standard for determining infectious virus. For most variants up through BA.1 (early 2023), culturable virus could be identified from most infected persons at day 5 (day 0 is the day the person first tests positive or first has symptoms, whichever occurred first), but few had culturable virus after day 10. It should be noted that the presence of culturable virus often continued past the point of improvement or resolution of acute symptoms (meaning that the resolution of symptoms, or signs such as fever, were not an indicator that the person was no longer infectious).
While initially it was thought that those with asymptomatic COVID-19 were likely not to play a significant role in transmission since it was assumed that they were asymptomatic due to a low viral load, it is now appreciated that asymptomatic infections play a significant role in transmission, and that, in fact, asymptomatic individuals have similar viral loads to those who were symptomatic. For reasons that remain unexplained, the secondary attack rate (the rate of infecting others) is lower in asymptomatic individuals vs. symptomatic ones. A possible explanation is that asymptomatic individuals appear to shed virus for shorter periods of time than symptomatic individuals do.
Similarly, early on, it was assumed that children did not play a significant role in transmission, and in late 2020, I subscribed to that view, though it troubled me because we know that school-aged children are the main drivers of influenza epidemics and I couldn’t understand why children weren’t the major driver for household transmission of COVID-19. Turns out, they were. It just took us until later the next year to get the evidence that confirmed that.
Let’s summarize:
Incubation period – the time from exposure to the SARS-CoV-2 virus to onset of symptoms (2 – 14 days, with a median of 5 days, though it is possible that the incubation period is shortening with some of the most recent Omicron variants – we just don’t have studies on these, yet).
[Note: A study referenced below in JAMA Network Open looked at the transmission characteristics of BA.5 (one of the Omicron variants with significant immune escape capabilities during August 7 – September 7, 2022 in China) and determined that the incubation period was 4.8 – 6.6 days and that the serial interval was 2.4 – 3.5 days, suggesting that the median incubation period had not changed that much since the initial studies reported at the beginning of the pandemic, but that the serial interval had shortened consistent with higher infectivity for the Omicron variants (the serial interval had previously been reported as 5.5 days with Delta and 4.7 days with Alpha). The investigators also found that receiving a booster dose of COVID-19 vaccine provided considerable additional protection against transmission of the BA.5 variant.]
Infectious period – the time period during someone who is infected is able to infect others (2 days prior to the onset of symptoms or the day on which the COVID-19 test becomes positive if the person has no symptoms through day 10 with the day of onset of symptoms or testing positive, whichever occurs earlier, being counted as day 0). We don’t have high quality studies of the infectious period with the most recent variants that I am aware of.
This Part II on the transmission characteristics of SARS-CoV-2 will be continued in the next blog post.
References:
- Identifying airborne transmission as the dominant route for the spread of COVID-19 – PMC (nih.gov)
- Outbreak Associated with SARS-CoV-2 B.1.617.2 (Delta) Variant in an Elementary School – Marin County, California, May – June 2021 Morbidity and Mortality Weekly Report September 3, 2021 https://www.cdc.gov/mmwr/volumes/70/wr/mm7035e2.htm?s_cid=mm7035e2_w
- Transmission of SARS-CoV-2 during Long-Haul Flight; CDC Emerging Infectious Diseases; November 2020 https://wwwnc.cdc.gov/eid/article/26/11/20-3299_article
- Transmission of COVID-19 (europa.eu)
- Incubation Period of COVID-19 Caused by Unique SARS-CoV-2 Strains: A Systemic Review and Meta-Analysis. JAMA Network Open August 22, 2022. https://jamanetwork.com/journals/jamanetworkopen/fullarticle/2795489
- https://www.cdc.gov/coronavirus/2019-ncov/hcp/non-us-settings/overview/index.html
- COVID-19 Isolation Guidance (ca.gov)
- SARS-CoV-2 viral load and shedding kinetics | Nature Reviews Microbiology
- Transmission Characteristics and Inactivated Vaccine Effectiveness Against Transmission of SARS-CoV-2 Omicron BA.5 Variants in Urumqi, China | Infectious Diseases | JAMA Network Open | JAMA Network
- Transmission Characteristics of SARS-CoV-2 That Hinder Effective Control – PMC (nih.gov)
- Occurrence and transmission potential of asymptomatic and presymptomatic SARS-CoV-2 infections: A living systematic review and meta-analysis – PMC (nih.gov)
- Post-lockdown SARS-CoV-2 nucleic acid screening in nearly ten million residents of Wuhan, China – PMC (nih.gov)
